

BREVARD COUNTY — Voters here have cast 52,585 ballots in the Aug. 18 primary as of Friday morning, or 11.96% of the county’s 439,576 active eligible voters, putting turnout modestly ahead of where the 2024 primary stood at the same point.

Early voting closes Saturday at 4 p.m. Election Day is Tuesday, with polls open 7 a.m. to 7 p.m. Here is where the numbers stand, what the last seven primaries suggest about where they are headed, and what we project for the final count.
Where turnout stands right now
Of the ballots in hand as of the 10:30 a.m. Friday update, 32,299 came by mail and 20,282 were cast at early voting sites. No Election Day votes have been cast yet.
By party, the ballots break down this way:
- Republican — 26,962 (51.3%)
- Democratic — 19,157 (36.4%)
- No party affiliation — 5,658 (10.8%)
- Other — 808 (1.5%)
Brevard’s active registration now stands at 205,580 Republicans, 110,807 Democrats, 106,529 non-partisan voters and 18,594 registered with minor parties. That is a Republican registration advantage of 94,773 voters, up from roughly 63,000 in 2022.

How this compares to past primaries
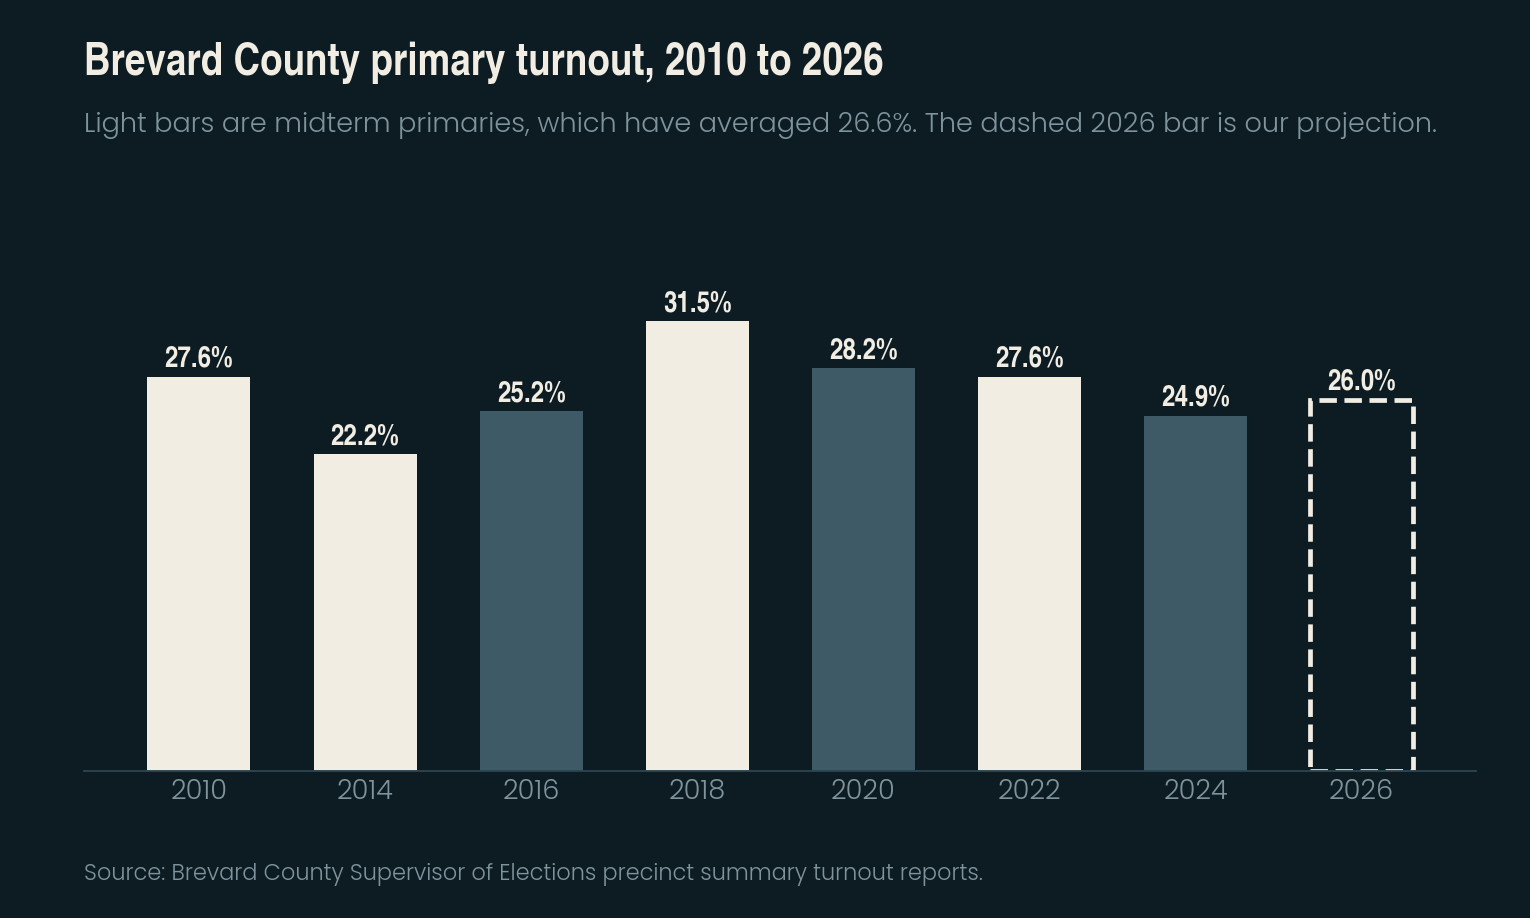
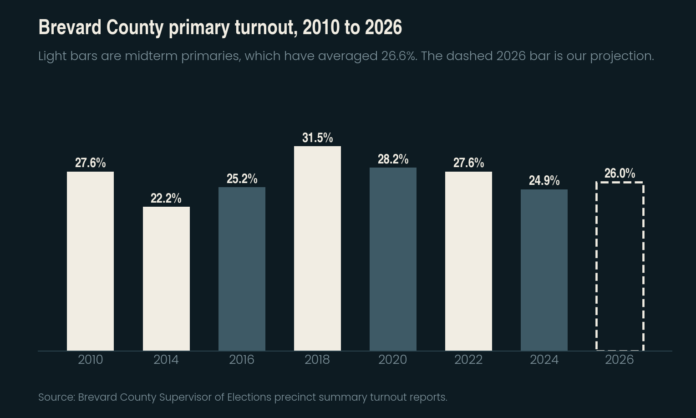
Midterm primary turnout in Brevard has run 27.6% in 2010, 22.2% in 2014, 31.5% in 2018 and 27.6% in 2022. Presidential-year primaries have come in lower: 25.2% in 2016, 28.2% in 2020 and 24.9% in 2024.
At this same point four days out, we estimate the 2024 primary was sitting near 11.1%. Brevard is at 11.96% today, roughly 8% ahead of that pace.
The bigger story is how people are voting
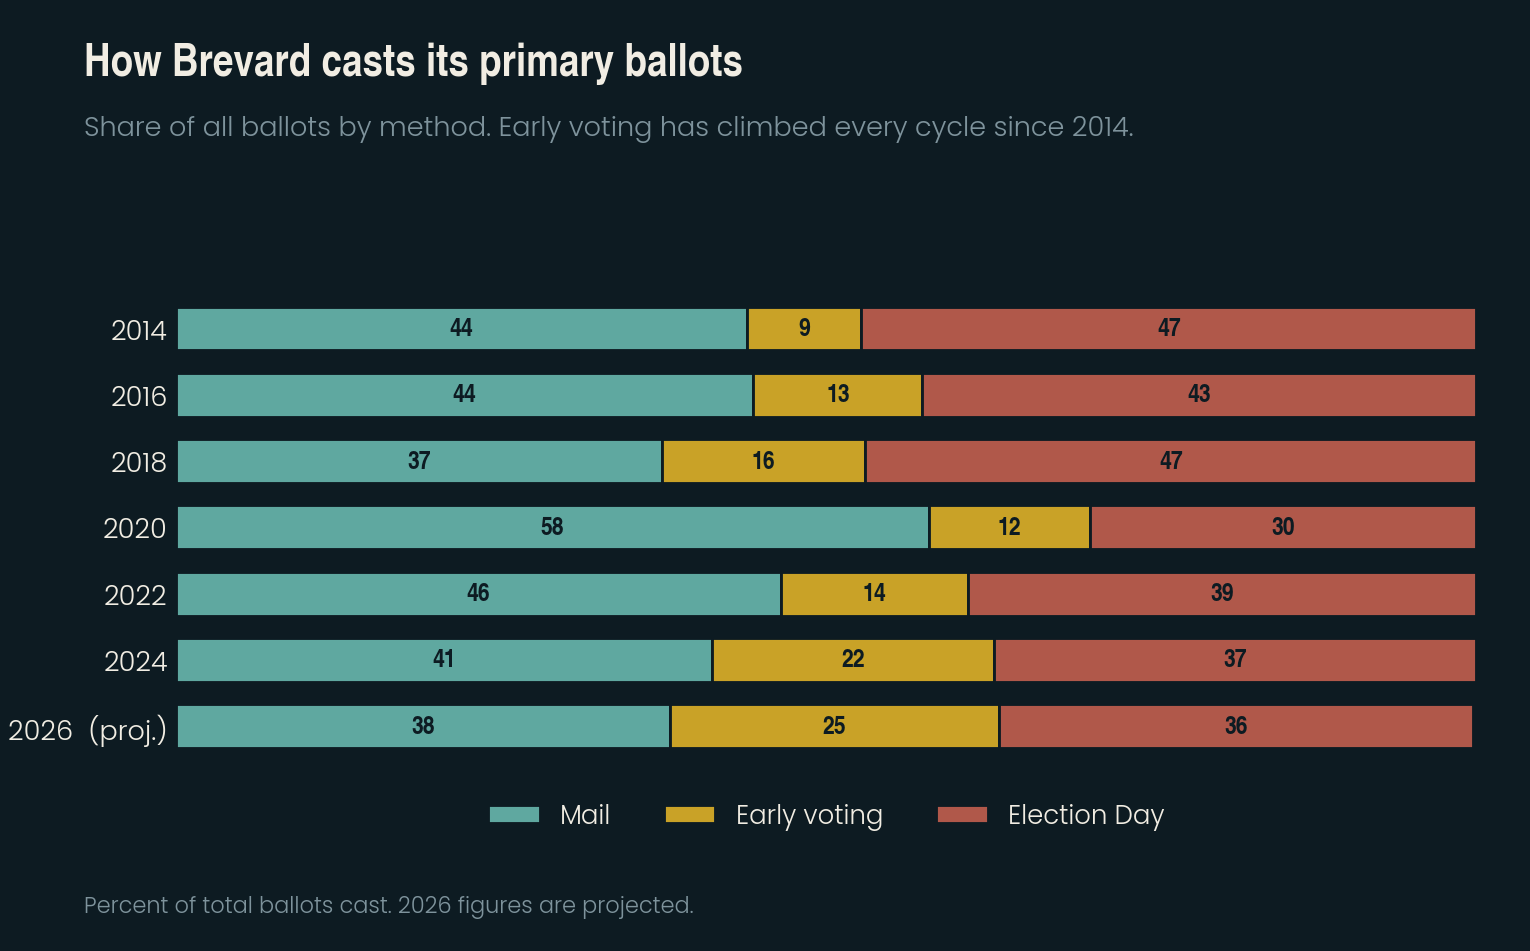
Early voting accounted for just 8.8% of all primary ballots in 2014. It reached 13.0% in 2016, 15.6% in 2018, 14.4% in 2022 and 21.7% in 2024. This year it is tracking toward roughly 25%.
Election Day has moved the other direction. It was nearly half of all ballots in 2014 (47.3%) and 2018 (47.0%). Since 2020 it has settled into the mid-to-high 30s.
The party picture
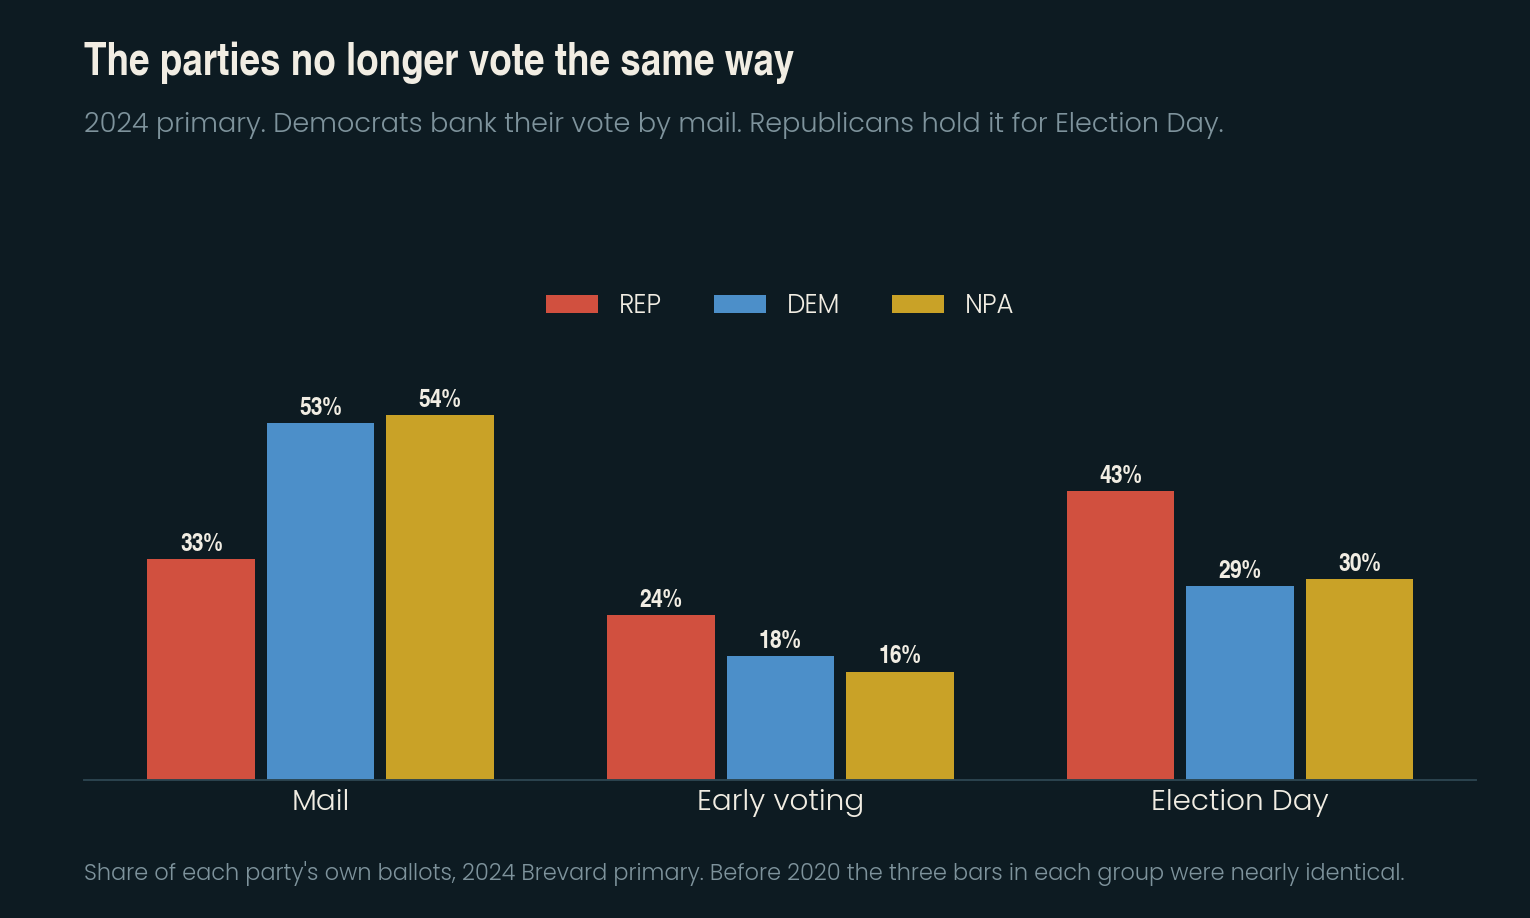
Republicans have banked more raw votes so far, but Democrats are outperforming their own recent history. Democratic pre-Election Day ballots are tracking about 12% ahead of 2024 on a registration base that has shrunk about 3%. Republican pre-Election Day ballots are up only about 4% on a base that grew 5%.
In short: Democrats have the intensity edge and Republicans have the numbers.
A word of caution on that 36.4%. The Democratic share you see on the county turnout page today is inflated by timing, not enthusiasm. Democrats front-load mail and early voting. Republicans have cast 42% to 48% of their vote on Election Day in every primary since 2020, compared with 28% to 30% for Democrats. Expect the Democratic share to fall toward 32% once Tuesday’s ballots are counted.
The mail pile is the biggest variable left
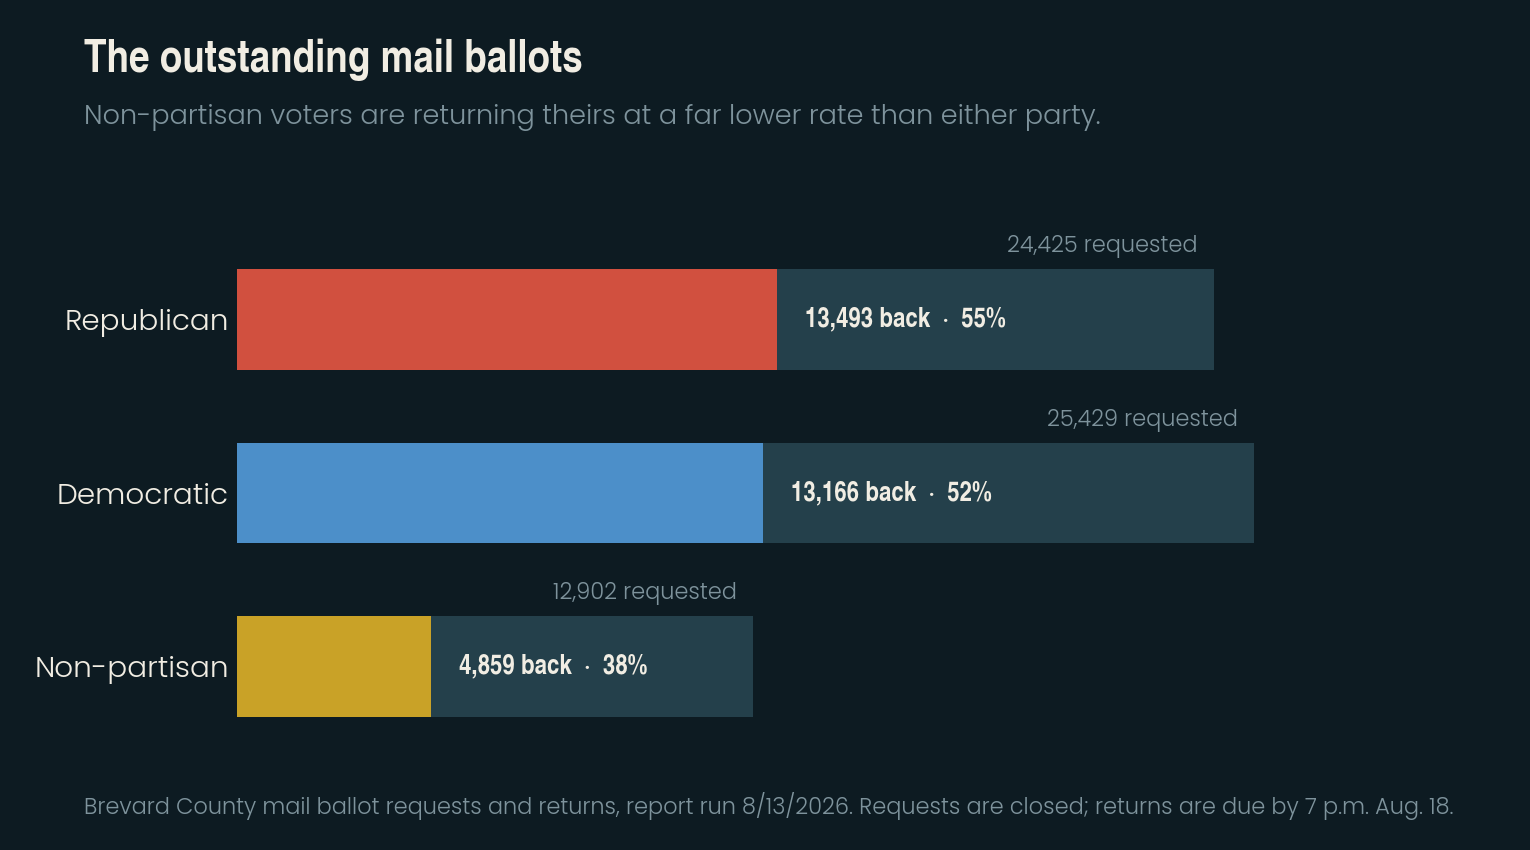
Requests are now closed, which puts a hard ceiling of 62,756 on how many mail ballots can possibly be cast. About 30,000 of them are still outstanding.
Non-partisan voters are returning theirs at just 38%, well behind Republicans at 56% and Democrats at 53%. That gap matters, because non-partisan voters can still weigh in on judicial races, School Board contests and other nonpartisan items on the ballot even though Florida’s closed primary keeps them out of the party races.
If you have a mail ballot sitting on the counter, it must be received by the Supervisor of Elections by 7 p.m. Tuesday. A postmark does not count. At this stage, hand delivery is the safe option.
What we project for the final count
| Category | Ballots | Share of all ballots |
|---|---|---|
| 43,500 | 38.0% | |
| Early voting | 29,000 | 25.3% |
| Election Day | 41,600 | 36.4% |
| Provisional | ~200 | 0.2% |
| Total | ~114,500 | 26.0% turnout |
Our range on the total is 25.0% to 27.5%.
Early voting should finish near 29,000 ballots, about 6.6% of eligible voters and up roughly 25% over 2024’s 23,225. We expect that to break down to about 18,900 Republican, 7,950 Democratic and 1,870 non-partisan.
Election Day should land near 41,600 ballots, with Republicans casting about 27,300 of them, or roughly two-thirds of the Tuesday vote. Democrats should cast about 10,000 and non-partisan voters about 3,800.
| Party | Projected ballots | Turnout rate |
|---|---|---|
| Republican | 64,500 | 31.5% |
| Democratic | 36,300 | 32.9% |
| Non-partisan | 12,000 | 11.3% |
| Other | 1,700 | 9.2% |
Two other things worth noting
Republicans traded a mail program for an early voting program. In 2018 Republicans cast 36% of their vote by mail and 16% early. By 2024 that had flipped to 33% mail and 25% early. This cycle roughly 49% of their banked vote has come through early voting sites.
Small changes in mail returns move the whole number. Every percentage point of return rate against 62,756 requests shifts the final total by about 630 ballots. That single variable is the biggest source of uncertainty in the projection above.
We will update these figures after early voting closes Saturday, and again with results Tuesday night.
How we built these numbers
Historical figures come from the Brevard County Supervisor of Elections precinct summary voter turnout reports for the 2010 through 2024 primaries, which report ballots by method and by party, and from the county’s precinct-level candidate result files. Current figures come from the county’s unofficial turnout dashboard as of 10:30 a.m. Aug. 14, 2026, and from the Mail Ballot Requests and Mail Ballot Returns reports run Aug. 13.
Early voting is projected from the observed hourly pace across the first six of eight voting days, adjusted upward for the acceleration that typically occurs on the final Friday and Saturday and trimmed for Saturday’s 4 p.m. close. Mail is projected by applying party-specific return rates to the closed request pool. Election Day is projected from the ratio of Election Day to pre-Election Day ballots in the 2022 and 2024 primaries, adjusted down slightly to account for early voting absorbing some Tuesday turnout. Projections are estimates and carry real uncertainty.
Criminal Defense
Bankruptcy · Evictions
WICKS LAW P.A.
Call or text for
free consult
321-733-2700
Eric Wicks, Esq.
1250 West Eau Gallie Blvd. G
Melbourne, FL 32935
Abogado Wicks habla español